
The stock order analytics is an interactive dashboard allowing users to view detailed analytics and statistics for your stock orders. This dashboard is comprised of useful charts, graphs, and other data filtered by specific time ranges (as shown below). To access the Stock Order analytics page, go to Orders > Stock Orders > Analytics.
Use the filter to update the dashboard to include stock orders by status (e.g., Finalized, Delivered, Placed, etc.) and date range (as shown below).

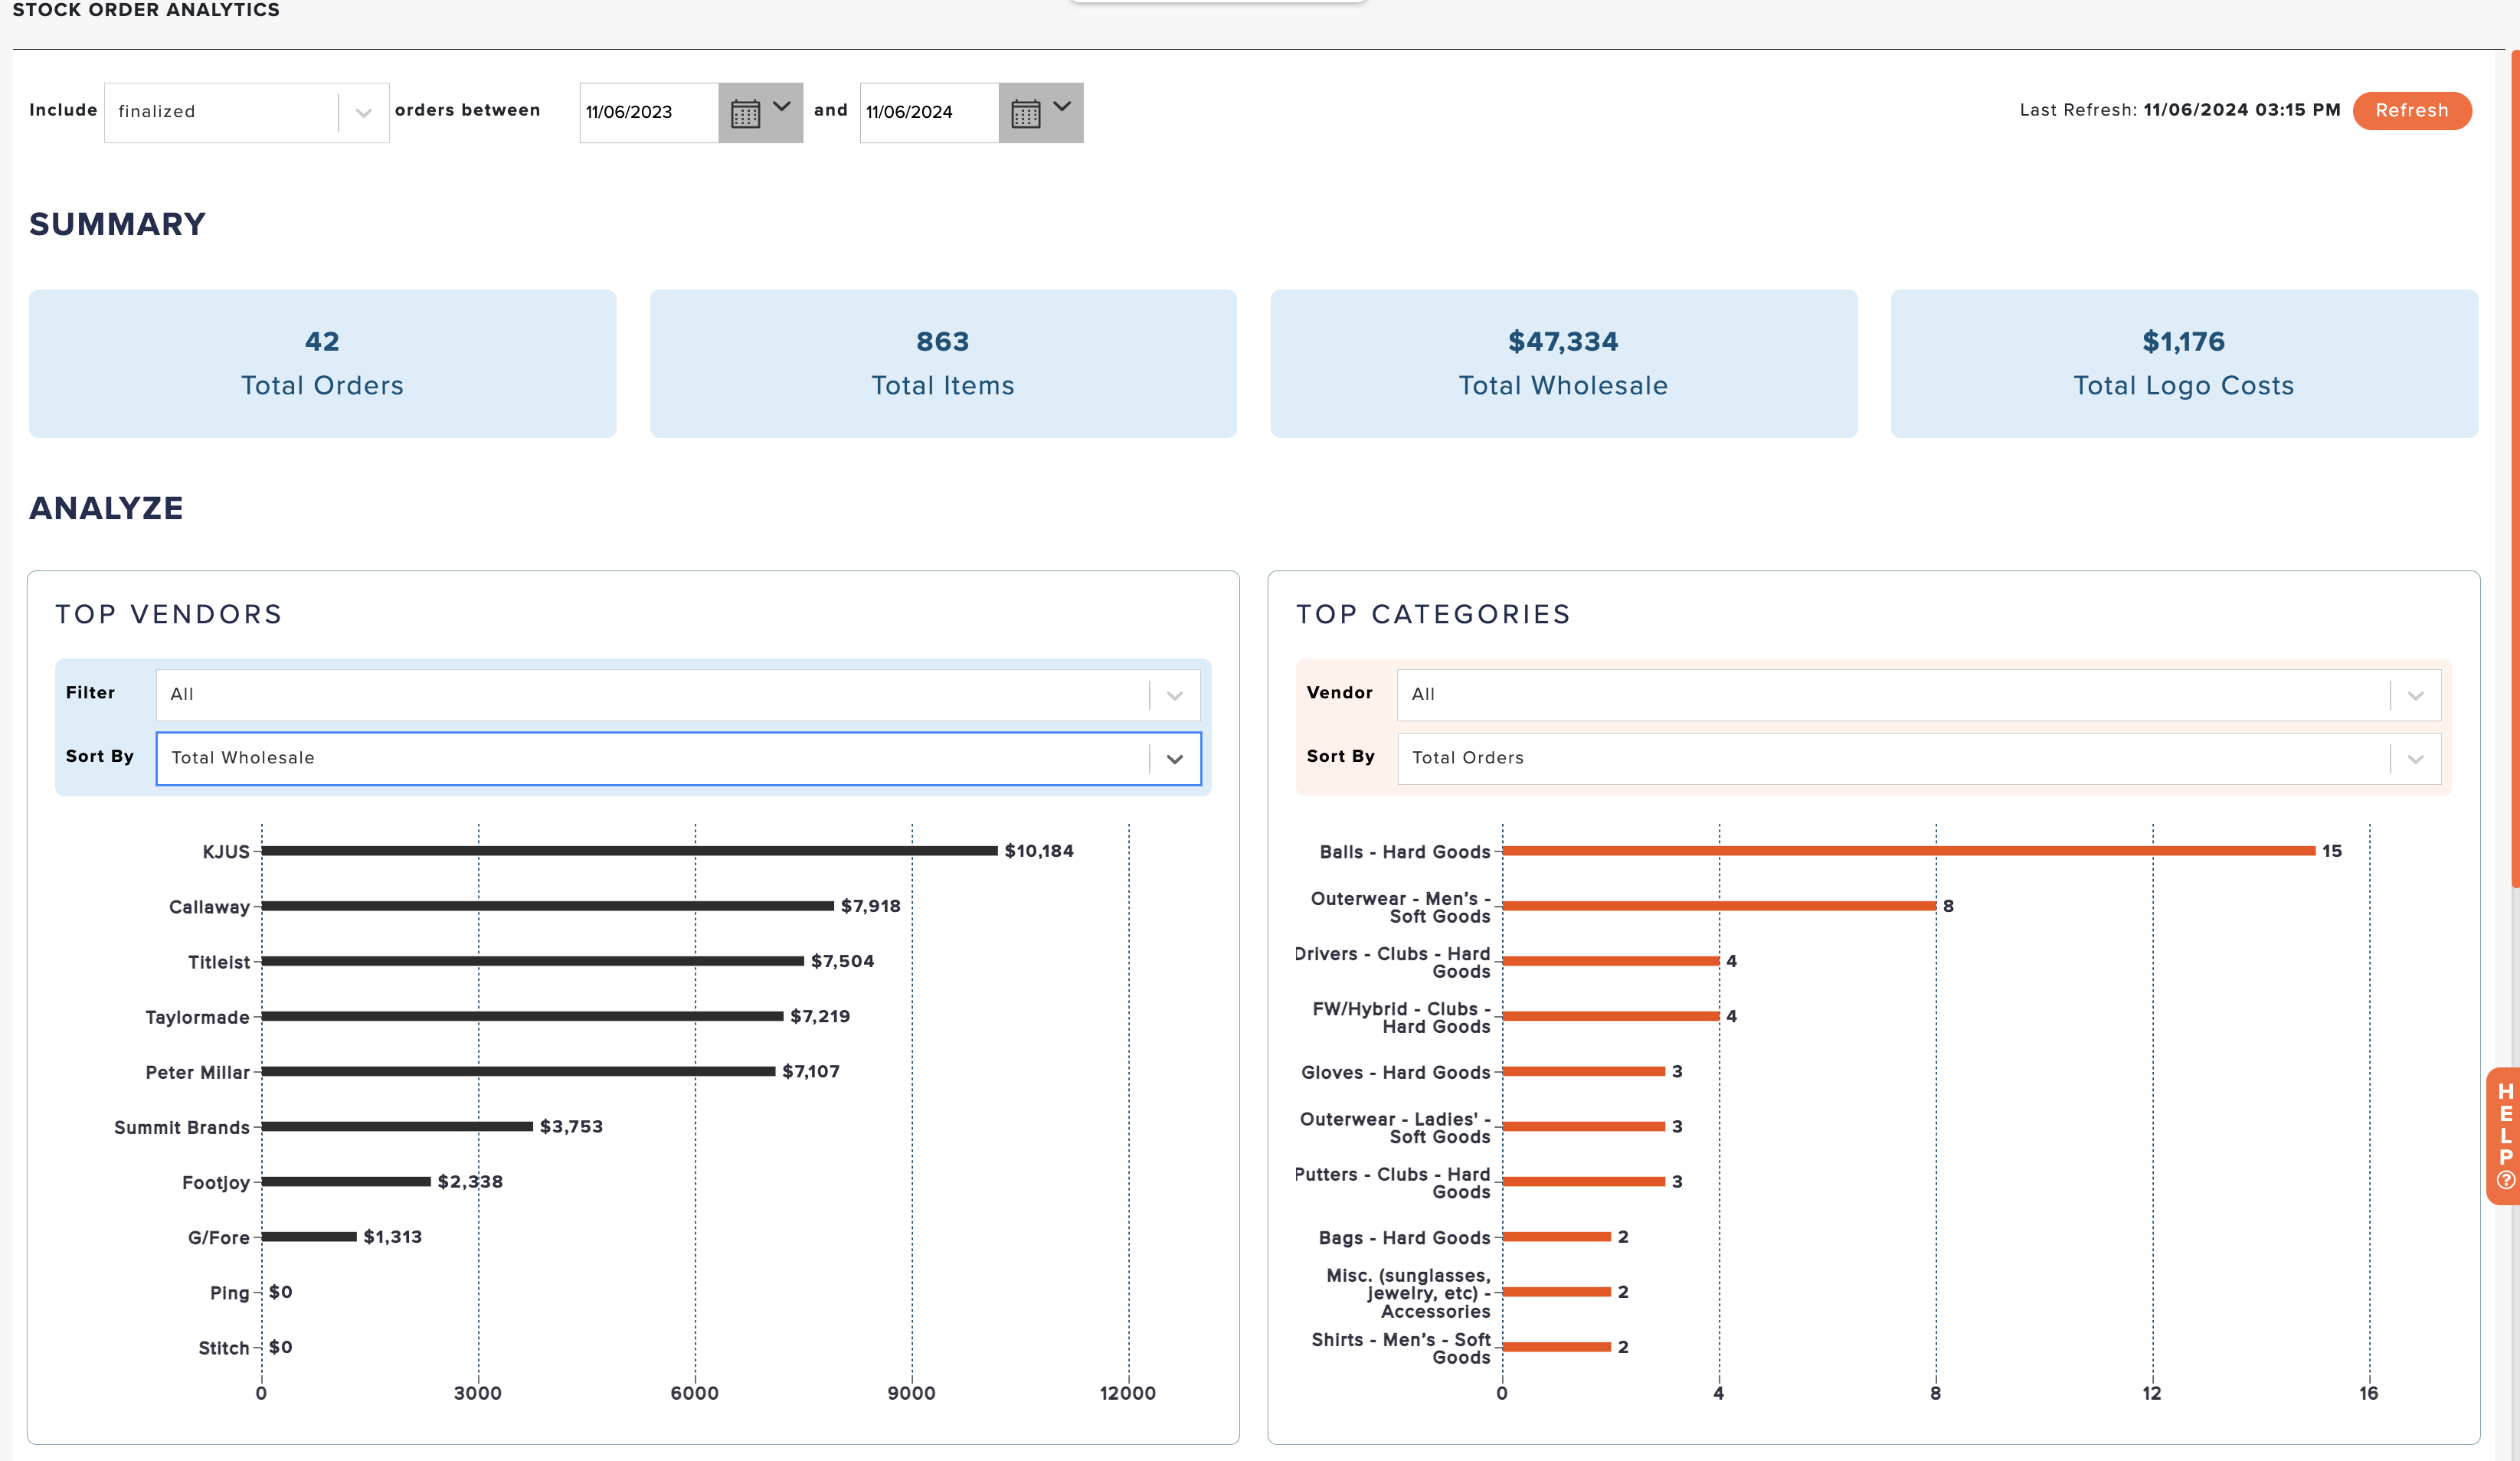
The dashboard will provide details in tiles for the following content:
Summary:
# of orders
# of total items
total wholesale
Total logo costs
Top Vendor:
Filter by: Categories
Sort by: Total Wholesale, Total Orders, Total Quantity of Items
Top Categories:
Vendor: Select all vendors or a specific vendor
Sort by: Total Wholesale, Total Orders, or Total Quantity of Items
Vendor Delivery Performance:
Listed by vendor:
Compares the Actual Delivery Time by average days before/after the start ship date, end ship date, expected ship date, or expected delivery date
Default to “Expected Delivery Date”
Order by best delivery performance first
Category Analyzer:
Answer questions like “how many XL men’s shirts do I have on order” or “how many black women’s bottoms did I sell last year?”
Select Category > Vendor (Optional) > Custom Field used for that category
Answers to the custom fields