
The special order analytics is an interactive dashboard allowing users to view detailed analytics and statistics for their special orders. This dashboard comprises useful charts, graphs, and other data filtered by specific time ranges (as shown below). Go to Orders > Special Orders > Analytics to access the Special Order analytics page.
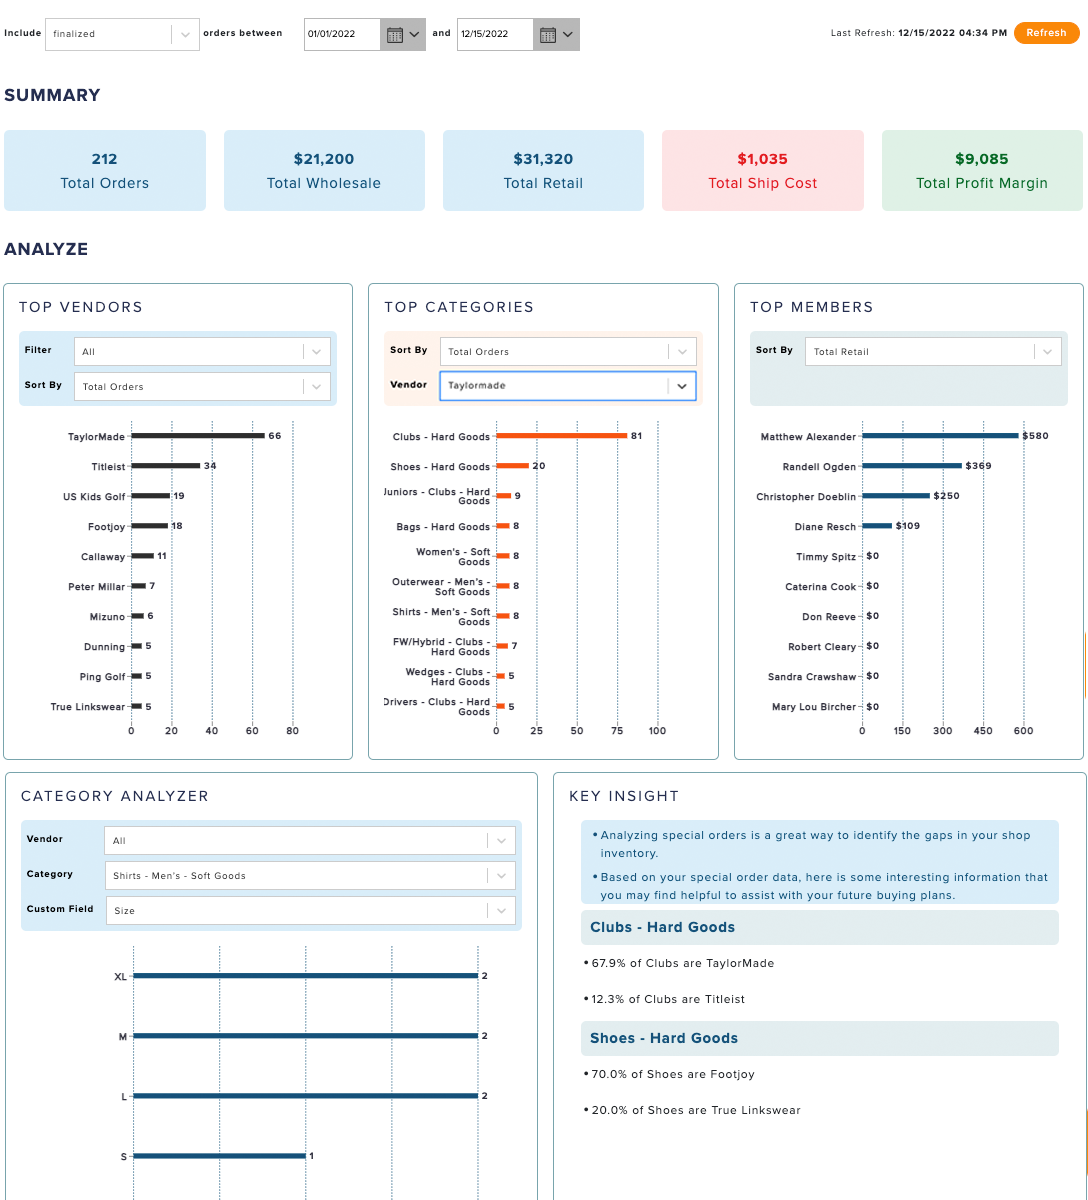
Use the filter to update the dashboard to include special orders by status (e.g., Finalized, Delivered, Placed, Entered) and date range (as shown below).

The dashboard will provide details in tiles for the following content:
Summary (including Golf Shop Customer Average):
# of Orders
Total Wholesale
Total Retail
Total Shipping Cost
Total Profit Margin - (Retail-Wholesale - Shipping Cost)
Top Vendors:
Top 10 vendors
Sort Orders by Total Retail, Total Wholesale, Total Orders, or Total Profit Margin
Optionally filter by a category
Top Categories:
Top 10 categories
Sort Orders by Total Retail, Total Wholesale, Total Orders, or Total Profit Margin
Optionally filter by a vendor
Top Members:
Top 10 members
Sort Order by Total Retail, Total Orders
Special Order Trend:
Line Chart showing # of special orders placed through time
Data points by week
Vendor Delivery Performance:
Delivery Time: Date order was placed to date it was marked as delivered
Average delivery time across all vendors
Filter by vendor and show # of orders used to compute the average
List Top 5 Vendors with best delivery times
Category Analyzer
Answer questions like “what is the size breakdown of special orders for men’s shirts”
Select Category > Vendor (Optional) > Special Order Custom Field used for that category
Display pie chart with answers to the custom field
Key Insight
Analyzing your special orders is a great way to find the gaps in your inventory ordering and assist with future buying. For instance, if you are special ordering numerous XXL shirts, you may want to consider ordering more XXL shirts for your inventory to manage the demand.
Provide key insight and identify notable information by:
Running a category analyzer through all possible combinations of (Vendor, Category, Special Order Custom Field)
Identify and highlight combinations with a significantly higher volume of ordering relative to other related combinations
This will highlight “hot buying patterns”
Member or Guest: Pie chart comparing member orders vs. guest orders
Drop Shipped: Pie chart comparing drop-shipped orders vs. regular orders
Method of Placing: Pie chart comparing order placement methods
Orders Returned vs. Kept: Pie chart comparing orders that were returned vs. orders that were kept